Retail analytics that
cut dead stock and boost sales.
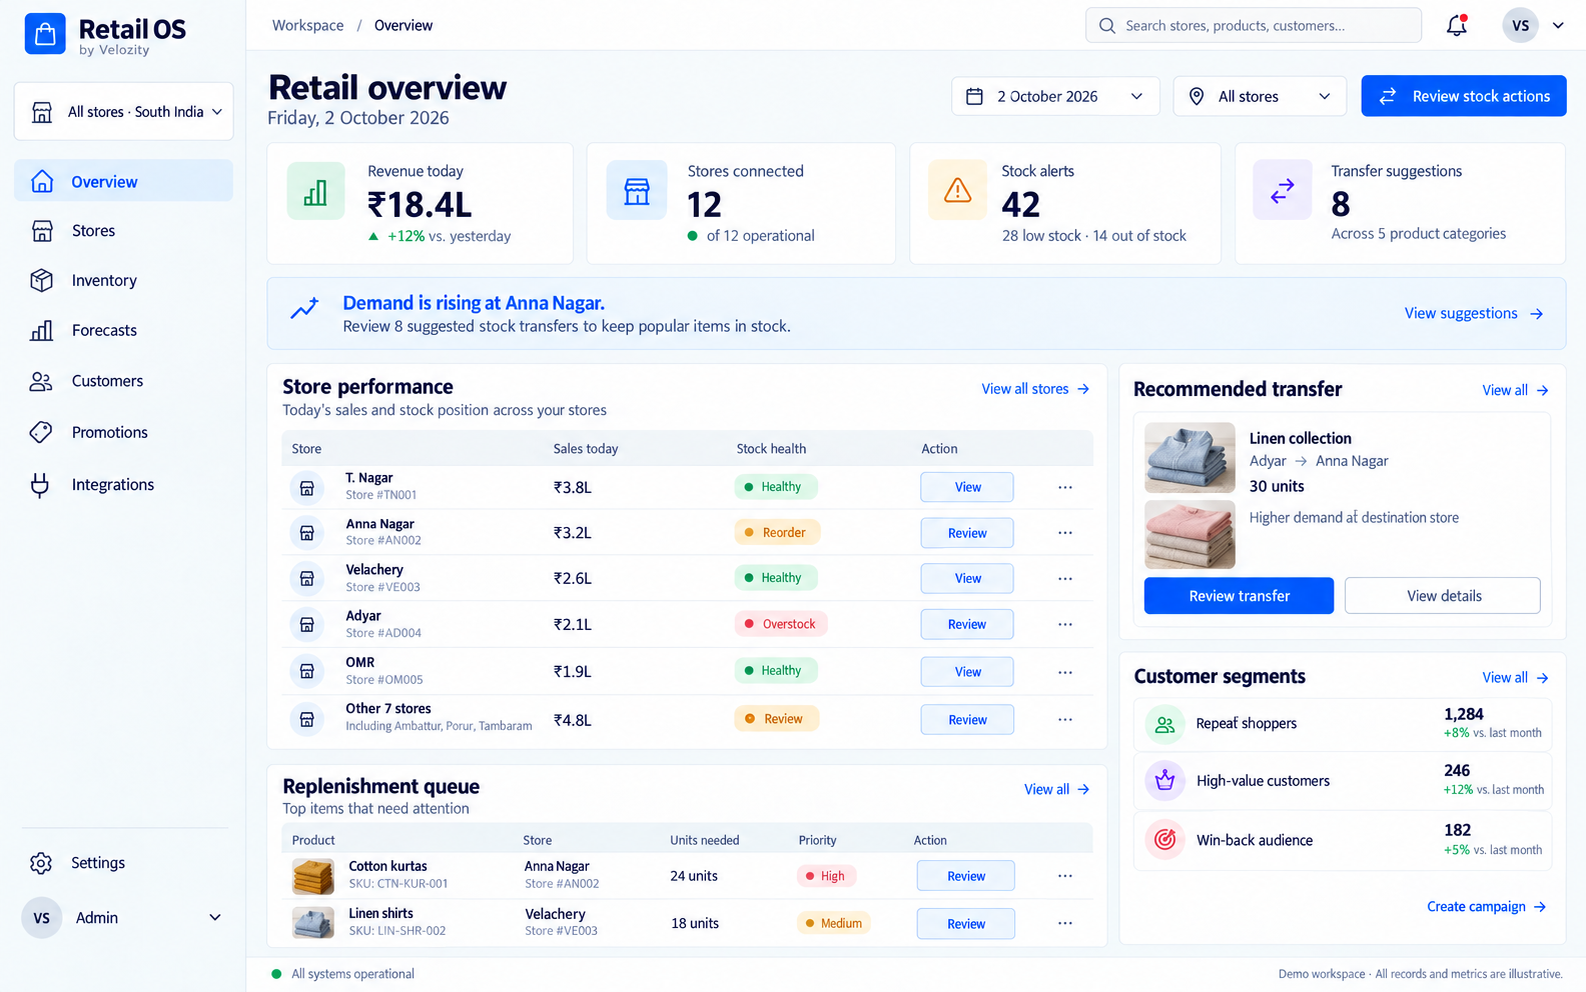
An analytics platform for Indian multi-store retailers. Forecast demand by store and category, optimise stock allocation, understand customer buying patterns, and see all your stores on one dashboard. Integrates with your existing POS and ERP.
What you are dealing with today.
Excess inventory in some stores, stockouts in others
Head office pushes inventory based on gut feel. Store A has 200 unsold pieces of a style that is selling out in Store B. There is no data-driven allocation mechanism.
No visibility into what is actually selling
POS data sits in siloed systems per store. There is no consolidated view of which categories, brands, or price points are performing. Buying decisions rely on supplier push and last season’s guesses.
Markdowns happen too late
Slow-moving inventory is identified only during end-of-season stocktakes. By then, it occupies shelf space for months. Markdowns are deeper than necessary because the problem was caught late.
From setup to results.
Connect your POS and inventory systems
Retail OS pulls sales and stock data from your POS terminals and ERP. Supports Ginesys, Gofrugal, Wondersoft, Tally, and custom systems via API. Historical data is imported for baseline analytics.
Connected POS Systems
All synced| Store | POS | Transactions/Day | Last Sync | Status |
|---|---|---|---|---|
| MG Road | Vend | 420 | Just now | Live |
| Indiranagar | Vend | 380 | Just now | Live |
| Koramangala | Lightspeed | 310 | Just now | Live |
| HSR Layout | Vend | 280 | Just now | Live |
AI analyses demand patterns by store and category
The system identifies trends, seasonality, and store-level demand signals. It compares sell-through rates, average selling prices, and stock turns across your entire network.
AI Forecast — Next 7 Days
Updated hourly| Category | Current Stock | Forecast Demand | Reorder | Action |
|---|---|---|---|---|
| Ethnic Wear | 248 | 310 | Yes | Order |
| Jewellery | 420 | 380 | No | — |
| Accessories | 180 | 210 | Yes | Order |
| Footwear | 320 | 290 | No | — |
Get stock optimisation recommendations
Retail OS recommends inter-store transfers, replenishment orders, and markdown candidates. Recommendations are based on current stock, sell-through velocity, and predicted demand.
Stock Optimisation
| Action | From | To | Items | Impact |
|---|---|---|---|---|
| Transfer | Koramangala | MG Road | 24 Ethnic Wear | +₹1.2L/wk |
| Reorder | — | Indiranagar | 48 Accessories | Prevent stockout |
| Markdown | HSR Layout | — | 12 Slow movers | Clear dead stock |
Monitor performance on the multi-store dashboard
Track daily sales, inventory health, shrinkage, and customer metrics across all stores. Drill down to any store, category, or SKU for detail. Weekly reports are generated automatically.
Store Performance
Export| Store | Revenue | Footfall | Conversion | AOV |
|---|---|---|---|---|
| MG Road | ₹2.8L | 420 | 32% | ₹680 |
| Indiranagar | ₹2.4L | 380 | 28% | ₹640 |
| Koramangala | ₹2.1L | 310 | 25% | ₹620 |
| HSR Layout | ₹1.8L | 280 | 24% | ₹590 |
What you get.
Demand forecasting by store and category
AI models predict demand at the store-category level using historical sales, seasonal patterns, and local events. Forecasts are updated weekly and improve over time as more data flows in.
Forecast Accuracy
Stock optimisation and inter-store transfers
Identify overstocked and understocked positions across your network. Get specific transfer recommendations — move 30 pieces of Style X from Store A to Store C — based on predicted demand.
Inter-Store
Customer analytics and segmentation
Understand repeat purchase behaviour, average basket size, and customer lifetime value. Segment customers for targeted promotions. Identify lapsed customers for re-engagement campaigns.
Segments
| Segment | Customers | AOV | Frequency |
|---|---|---|---|
| VIP | 480 | ₹2,400 | Monthly |
| Regular | 2,100 | ₹650 | Quarterly |
| New | 840 | ₹420 | First visit |
POS integration
Pull real-time sales data from your POS terminals. Retail OS supports Ginesys, Gofrugal, Wondersoft, Tally, and any POS with an API or database export. No double entry required.
Real-Time Sync
Multi-store dashboard
A single view of all your stores. Compare sales, stock turns, shrinkage, and customer footfall. Identify top-performing and underperforming stores at a glance.
Portfolio
Markdown and promotion analytics
Track the effectiveness of markdowns and promotions in real time. See which promotions drive incremental sales versus cannibalising full-price sales. Optimise discount depth and timing.
Promotion ROI
| Campaign | Discount | Uplift | ROI |
|---|---|---|---|
| Festive Sale | 20% | +180% | 4.2x |
| BOGO Week | 50% | +240% | 2.8x |
Watch a quick demo.
Retail OS in 60 seconds.
What it looks like in practice.
12-store ethnic wear retail chain in South India
The chain was carrying 40% excess inventory across stores while frequently running out of bestselling styles. Stock allocation was done manually by the buying team based on intuition. End-of-season markdowns were eating into margins because slow movers were identified too late.
After deploying Retail OS, the buying team received weekly stock optimisation recommendations. Inter-store transfers moved slow-moving inventory to stores where demand existed. Sell-through rate improved by 15%, and end-of-season residual stock dropped significantly.
"We always knew some stores had too much stock and others too little, but we could never act on it fast enough. Retail OS gives us specific transfer recommendations every week. Our dead stock is down 30% and we are selling more at full price." — Data replaced gut feel in stock allocation.Priya Ramachandran, Operations Head, Ethnic Wear Retail Chain
Works with your existing tools.
Enterprise-ready from day one.
Cloud deployment
- SaaS platform accessible from any browser
- Multi-store, multi-brand support
- Automatic daily data sync from POS
- Mobile-responsive dashboard
- Go-live in 2 to 4 weeks including historical data import
Data and security
- Data hosted in Indian data centres
- Role-based access for store managers, buyers, and leadership
- Encrypted data in transit and at rest
- Automated daily backups
- Data retained as per your policy — minimum 3 years
Clear pricing. No surprises.
Pricing depends on your team size, deployment, and support needs.
Per-store pricing. Volume discounts for 10+ stores. GST extra.
INCLUDES
- Demand forecasting and stock optimisation
- Customer analytics and segmentation
- POS integration setup
- Multi-store dashboard
- Weekly automated reports
- Email and phone support
Built for specific needs.
Good fit
- Multi-store retail chains with 5 or more outlets
- Ethnic wear, fashion, and lifestyle brands with seasonal demand
- Retailers with excess inventory and frequent stockouts happening simultaneously
- Retail businesses expanding to new cities and needing data-driven stock allocation
- Franchise operations needing visibility across franchise stores
Not designed for
- Single-store retailers (the per-store cost is hard to justify under 3 stores)
- E-commerce-only businesses (built for physical retail)
- Grocery and FMCG retailers with very low margins per SKU
- Retailers without a POS system (POS data is required)
Which POS systems does Retail OS integrate with?+
We support Ginesys, Gofrugal, Wondersoft, Tally, and SAP Retail out of the box. Any POS with an API or database export can be integrated. We handle the integration setup.
How accurate is the demand forecasting?+
Forecast accuracy depends on data history and category variability. Most retailers see 70 to 85% accuracy at the store-category level within 8 weeks of deployment. Accuracy improves as more data is processed.
How long does setup take?+
Typical go-live is 2 to 4 weeks, including POS integration, historical data import, and team training. Stores with clean POS data can go faster.
Can we see data at the SKU level?+
Yes. Analytics are available at the store, category, brand, style, and SKU level. You can drill down from the multi-store dashboard to any individual SKU.
Does it handle seasonal demand patterns?+
Yes. The AI models account for seasonality, festival periods, and local events. You can also input planned promotions and new store openings to improve forecast accuracy.
Can we use it for franchise stores we do not own?+
Yes. Franchise stores can share POS data through a secure integration. Franchise owners get a limited dashboard view of their own stores. Head office sees the full network.
How is pricing structured for large chains?+
Per-store pricing with volume discounts for 10 or more stores. Enterprise pricing is available for chains with 50 or more outlets. Contact us for a custom quote.
Related guides.
RFID vs barcode: why retailers are switching
Speed, accuracy, and cost comparison for Indian retailers.
Read the guideTurn AI feedback into an improvement process
Corrections are valuable when they become evidence for a deliberate change.
Read the guideHow to choose your first AI workflow
A practical way to move from ideas to a first project.
Read the guideLooking for pricing and comparisons? See our detailed guide: Retail Billing Software India
Retail OS.
Let's set it up.
Book a 20-minute demo, get a quote, or just ask a question.
Our team in Chennai responds within one working day.